A data-driven look at how Christmas-themed TV episodes rise and fall with industry confidence.

Why I Built This
This is the second project for rewindOS. This project is part of a short Christmas programming sprint designed to explore how holiday-themed television functions as a cultural signal rather than a novelty. I started with a simple question: Are Christmas episodes still as prevalent as they were during the era of long-running television shows? In earlier decades, holiday episodes were almost guaranteed milestones for successful series, so I wanted to understand how that tradition has changed in the modern TV landscape.
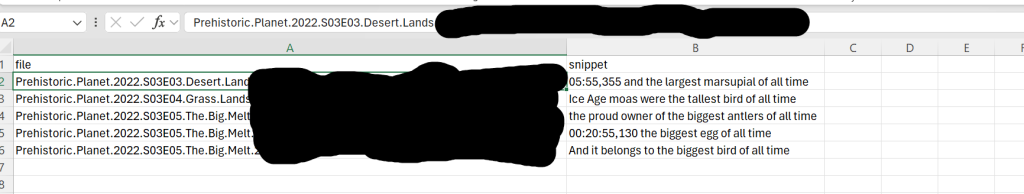
The first step was to measure actual output specifically, and so I went to wikipedia to see if they had a list of Christmas Episodes for TV. They had an extensive list that was used for the dataset of this project. Then I used python coding to produce a graph for how many Christmas-themed television episodes were produced between 1947 and 2025, and looked at the downward spiral of shows from 2023-2025 and how that compares to earlier periods.
From there, the sprint expands into a few focused, related experiments rather than a single large dataset.
Next, I plan to track Christmas music usage within TV episodes, looking at which songs appear, how frequently music is used, and what types of Christmas music are favored. This portion will intentionally stay small, focusing on two to three well-known sitcoms, to keep the analysis tight and interpretable.
The sprint will conclude with a beta test of a controversy index, applied to a Christmas-themed case study, as a way to explore how sentiment, cultural backlash, or reinterpretation can affect holiday media over time.
All of these projects are designed to be completed within one to two weeks, serving as a focused seasonal experiment while also laying groundwork for broader RewindOS cultural analytics moving forward.
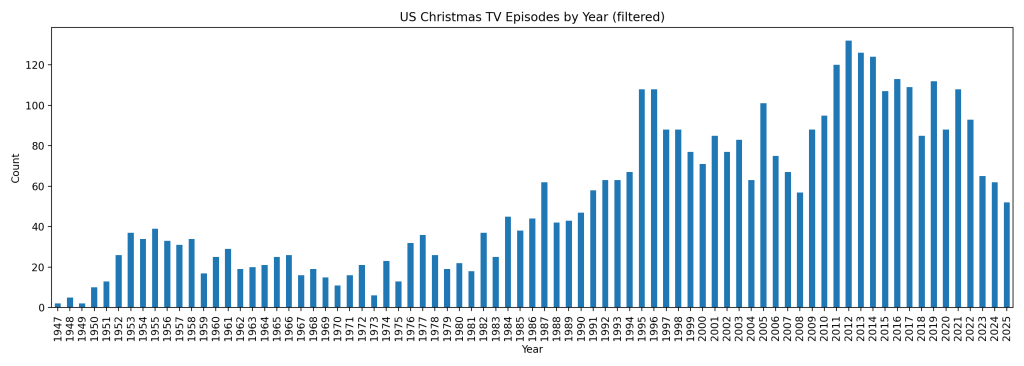
When we chart U.S. Christmas-themed TV episodes over time (excluding standalone specials), we see that they begin appearing consistently in the 1950s, rise steadily, and then fluctuate in clear cycles. Major declines occur in 1998–2000, 2006–2008, and again starting in 2023. Notably, 2008 and 2025 mark the lowest levels of Christmas episodes in modern television, matching periods of industry instability. The most productive era was 2012–2023, driven by long-running, sitcoms with over 5 seasons.
Expanding on what the data shows (so far)
Using a filtered dataset of U.S. television Christmas-themed episodes (excluding standalone holiday specials and animation), several clear patterns emerge:
🎄 Long-term rise, then contraction
- Christmas-themed TV episodes begin appearing consistently in the 1950s, aligning with the rise of broadcast television and stable seasonal scheduling.
- Prior to that, occurrences are sparse, with 1973 marking the lowest point for Christmas episodes in the modern TV era.
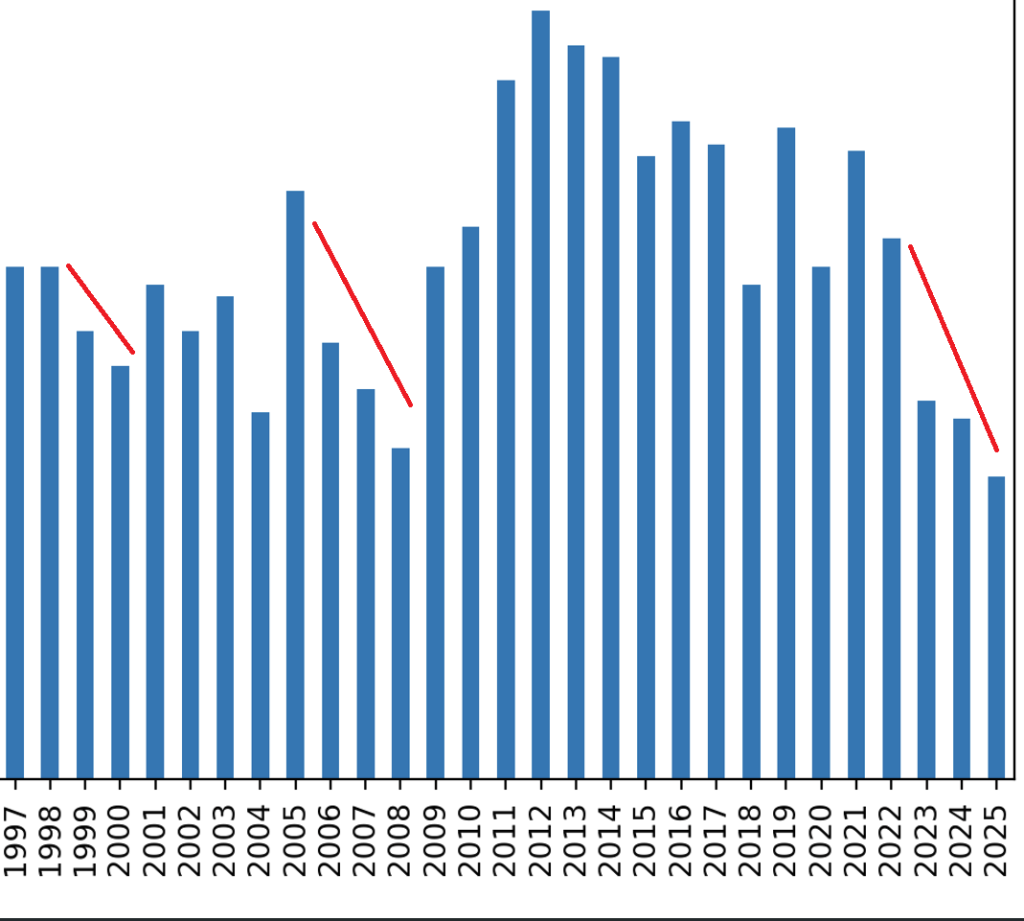
Repeated contractions in Christmas episode production align with broader industry disruptions.
📉 Structural dips repeat over time
- Three periods show notable declines in Christmas episode production:
- 1998–2000
- 2006–2008
- 2023–2025
- These downturns closely resemble each other in magnitude and shape, suggesting recurring industry-wide contractions rather than random fluctuation.
❄️ Modern low points
- 2008 and 2025 stand out as the lowest years for Christmas episodes in modern television, placing today’s output on par with the post-network-era shock of the 2008 Writers’ Strike period.
- The current decline beginning in 2023 suggests a sustained trend rather than a single anomalous year.
📈 Peak era: 2012–2023

- The years 2012 through 2023 represent the highest sustained production of Christmas-themed episodes.
- This era is largely fueled by:
- Highly successful, long-running sitcoms
- Large ensemble casts
- Stable season orders (22 Episodes ftw!!!!)
- Continued contribution from U.S. animation (even when animation is excluded from the core count, its ecosystem supports the broader trend)
This period reflects an industry confident in long arcs, recurring characters, and calendar-based “event episodes.”
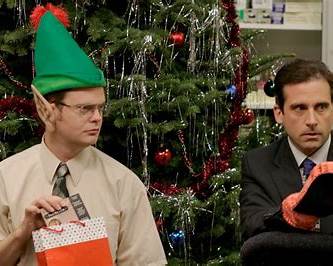
Long-running ensemble sitcoms dominated the peak era of Christmas television episodes (2012–2023).
Christmas episodes function as a high-confidence production choice:
- They assume a show will still be on the air in December
- They reward audience loyalty
- They often require additional budget, music licensing, and scheduling certainty
Their decline aligns with periods of:
- Shorter seasons
- Higher show churn
- Platform fragmentation
- Labor disruption or industry uncertainty
This suggests that Christmas episodes may act as a proxy indicator for scripted TV stability, not just seasonal nostalgia.

This data in no way shape or form indicates that there is an overall agenda driven message surrounding Christmas itself on TV. It just shows that there is a decline in Television confidence in general and so holiday themed episodes are either cut or don’t make sense when a show doesn’t have 22 episodes or won’t be around during the holidays.
My original thought going into this project was that the years 2020-2025 would show a major decrease but as you can see 2023 had a high output of Christmas themed episodes.
If you want to see or run the Python script used for this analysis, the full repository is here:
👉 GitHub: https://github.com/jjf3/Rewindos-Christmas-Episodes